





Business analysts most commonly use context diagrams, BPMN, use case diagrams, ERDs, DFDs, sequence diagrams, and state machine diagrams. Each serves a different purpose, from defining system boundaries to modeling data, processes, and interactions.
You are opening our English language website. You can keep reading or switch to other languages.

06.07.20266 min read
Essential Diagrams for Business Analysts: When to Use Each One
We often say a picture is worth a thousand words, but for analysts the right diagram is worth even more. Denys Gobov, Head of DataArt’s Business Analysts Lab, shares a concise guide to the most useful diagram types for IT projects. From BPMN to ERDs, he explains when and why each visual tool helps analysts communicate clearly and avoid misunderstandings.
Audio Version0:00
4:22
Senior Business Systems Analyst
India
Senior Business Analyst
Belgrade, Cluj-Napoca, Dnipro, Kharkiv, Krakow, Kyiv, Larnaca, Lodz, Lublin, Lviv, Monterrey, Montevideo, Odesa, Remote.AR, Remote.BR, Remote.BG, Remote.CO, Remote.GE, Remote.PL, Riga, Rosario, Sofia, Tbilisi, Varna, Warsaw, Wroclaw, Yerevan
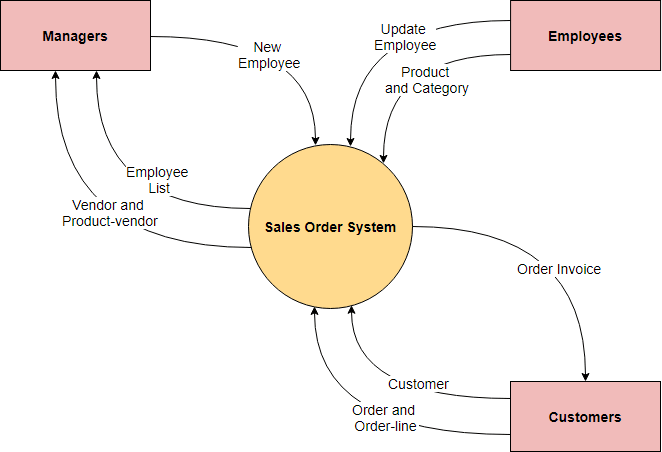
Context Diagram
A context diagram shows how data moves between a system and external entities (users, systems, organizations). It helps illustrate how information is exchanged.
When to use:
- Early in analysis, to define system boundaries and interactions with the outside environment.
- When speaking with stakeholders to ensure a shared understanding of the system.
These diagrams show the system as a "black box", helping business and technical teams avoid misunderstandings by giving everyone a clear starting point for analysis.
BPMN (Business Process Model and Notation)
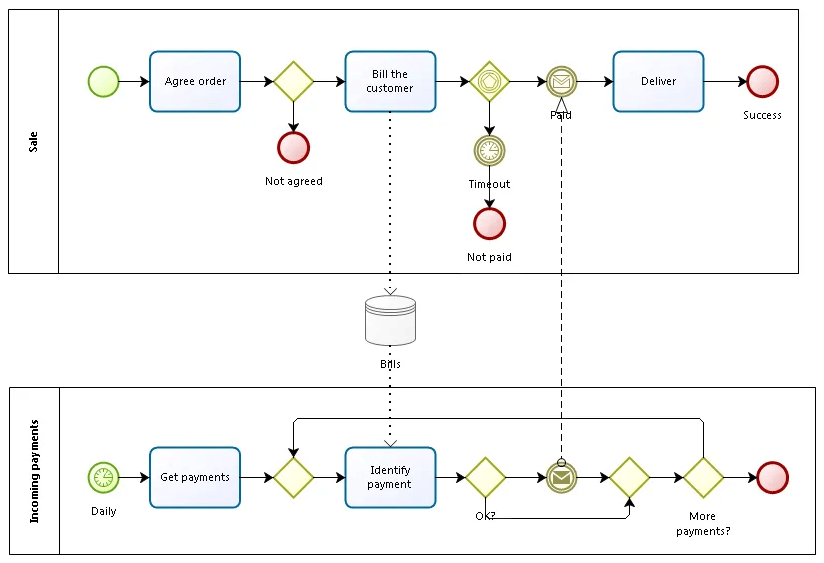
BPMN is the leading notation for business process modeling. Its broad range of elements allows you to capture the nuances of business processes.
When to use:
- To analyze, improve, or automate business processes at any stage of the project
- To document current business processes
BPMN provides a clear view of business operations for both technical and non‑technical users, making it easier to analyze and improve how things work.
Use Case Diagram
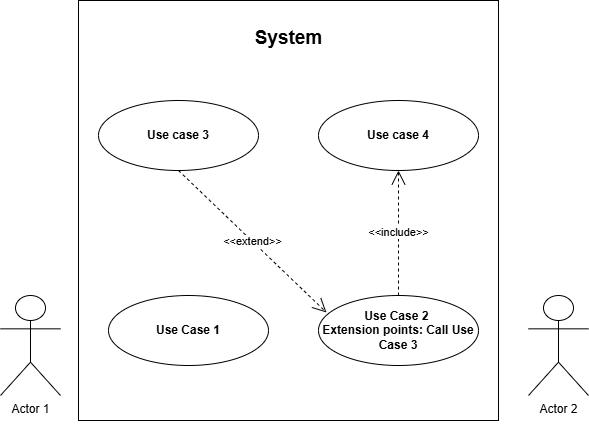
A use case diagram shows what the system does, who uses it, what actions they take, and how those actions connect.
When to use:
- During requirements gathering, to identify key system functions
- To break down the system's functional requirements
Use case diagrams help define the system from a functional perspective.
Entity–Relationship Diagram (ERD)
An ERD describes the system's data structure by mapping entities (objects), their details, and their relationships. It's used to model data structures.
When to use:
- During database design or analysis
- To document the system's data structure before development
- During system integration, when data alignment is needed
ERDs offer a clear view of the data structures, helping prevent errors in database design and improving communication between analysts and developers.
State Machine Diagram
A state machine diagram shows the lifecycle of an entity (e.g., an application, a customer, an account) by visualizing states and the transitions triggered by events.
When to use:
- To model the lifecycle of entities
- When analyzing complex systems with defined states
- For designing systems with dynamic behavior
State machine diagrams help predict all possible behavior scenarios, lowering the risk of logic errors during system development.
Data Flow Diagram (DFD)
A DFD shows how data moves through a system by visualizing processes, data flows, data stores, and external entities.
When to use:
- To analyze and document how data moves within a system
- During system design, when understanding data processing is crucial
- To find bottlenecks in information flows
DFDs clearly display how data travels between processes, external entities, and data stores, helping optimize processes and detect potential issues in information flows.
Sequence Diagram
A sequence diagram illustrates system behavior by showing the timeordered exchange of messages between objects, actors, and external systems within a scenario.
When to use:
- To detail use case scenarios and show how the system performs specific functions
- When analyzing complex interactions between components
- When designing system integrations
Sequence diagrams clarify the dynamics of interactions, supporting design, development, and testing.
Conclusion
Diagrams make complex ideas tangible. They align teams, uncover gaps, and communicate insights throughout a project. By choosing the diagram that fits your goal, you can simplify communication, speed up decisions, and help everyone stay on the same page.
Subscribe to our IT Pro Digest
From AI and business analysis to programming tutorials and soft skills, we have it all!
You may also find this interesting
What diagrams should a business analyst use most often?
What is a context diagram used for in business analysis?
When should I use BPMN instead of other process diagrams?
How does a use case diagram help with requirements gathering?
What is the purpose of an entity–relationship diagram (ERD)?
When is a data flow diagram more useful than a process diagram?
Why are sequence diagrams important for system design?
What problems do state machine diagrams help prevent?
What is a common mistake analysts make when using diagrams?
How can diagrams improve communication with stakeholders?


