
Thread groups
Thread Groups in JMeter are elements that control the number of threads and their behavior during your test execution. The default Thread Group in JMeter allows you to create only a constant load, with some warm-up at the beginning of the test. In practice, to create a step load, you will need additional plugins.
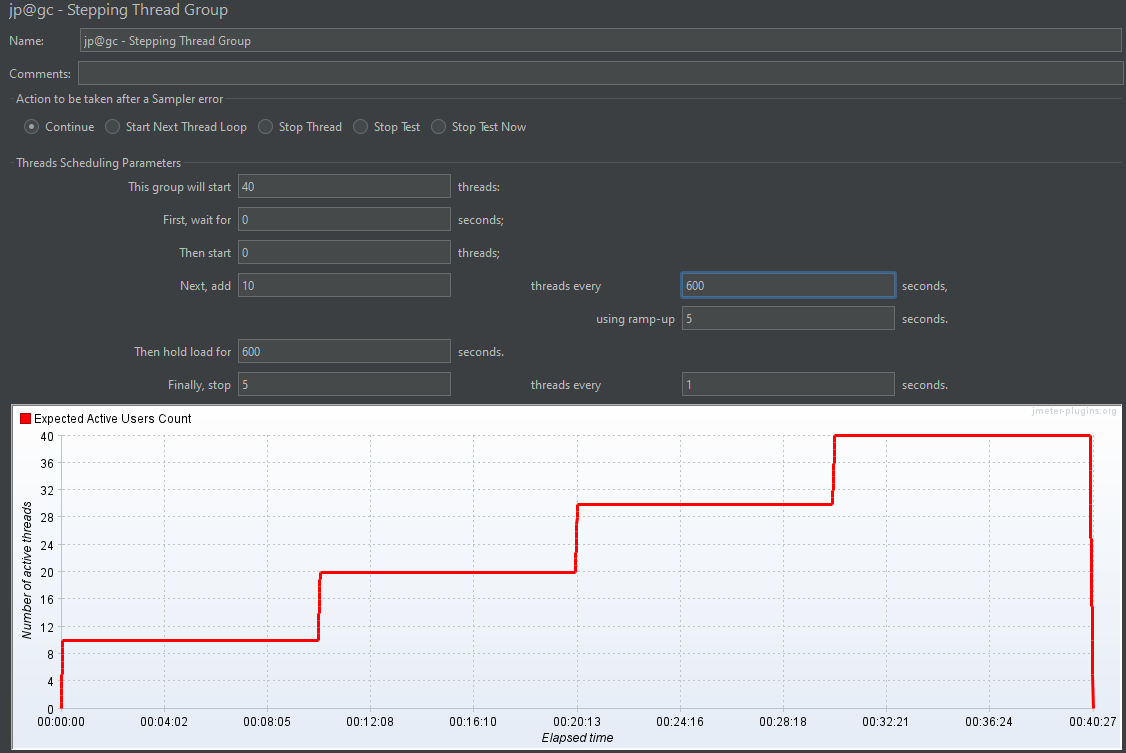
Step thread group
Download it here.
The Step thread group in Apache JMeter is an advanced thread group type that allows you to create more complex and controlled load testing scenarios compared to the default thread group. You can specify how many threads to start at a time and the interval between starting each set of threads.

Configuration Parameters:
- Start Threads Count: Number of threads to start initially.
- Initial Delay (in seconds): Delay before starting the threads.
- Start Threads Interval (in seconds): Interval between starting each set of threads.
- Increment Threads Count: Number of threads to add at each interval.
- Hold Load for (in seconds): Duration to hold the peak load.
- Stop Threads Count: Number of threads to stop at each interval.
- Stop Threads Interval (in seconds): Interval between stopping each set of threads.
Ultimate thread group
Download it here.
The Ultimate thread group in Apache JMeter is another advanced thread group type that provides even more flexibility and control over load testing scenarios than the default and Stepping Thread Groups. It is part of the JMeter Plugins that allows you to design complex load patterns with precise control over the start, hold, and stop times of threads.
The Ultimate Thread Group is configured using a table where each row represents a different stage of the load test. Here are the key parameters for each stage:
- Start Threads Count: Number of threads to start at the beginning of the stage.
- Initial Delay (in seconds): Delay before starting the threads for this stage.
- Start Threads Period (in seconds): Duration over which the threads are started (ramp-up period).
- Hold Load for (in seconds): Duration to hold the threads at the peak load for this stage.
- Stop Threads Count: Number of threads to stop at the end of the stage.
- Stop Threads Period (in seconds): Duration over which the threads are stopped (ramp-down period).
Logic Controllers
Logic Controllers help you determine the order in which requests are processed and can add conditions, loops, and randomness to your test scenarios.
HTTP/2 Plugin
Download it here.
To perform performance testing of HTTP/2 protocols in Apache JMeter, you need to use the HTTP/2 Plugin. HTTP/2 is the latest version of the HTTP protocol, designed to improve performance by reducing latency, decreasing load times, and enhancing the overall user experience. The plugin allows you to leverage HTTP/2 features like multiplexing, header compression, and server push to enhance your performance testing capabilities. This setup ensures that you can analyze and optimize your application’s performance for users utilizing modern web technologies.
Weighted Switch Controller
Download it here.
The Weighted Switch Controller in JMeter is a useful feature that allows you to distribute the execution of multiple test elements based on specified weights. This can be particularly handy when you want to simulate different load distributions across various scenarios or endpoints in your test plan.
Listeners
In Apache JMeter, listeners are components that allow you to view and analyze the results of your performance tests. They collect and present data such as response times, throughput, error rates, and more. Listeners can present data in various forms, such as tables, graphs, and charts, and can also write data to files for later analysis.
Hits per sec
Download it here.
You can use listeners in JMeter designed to provide detailed metrics and graphs, to specifically monitor and visualize hits per second. Although JMeter does not have a dedicated "Hits per Second" listener out-of-the-box, you can achieve this functionality using existing listeners and plugins.
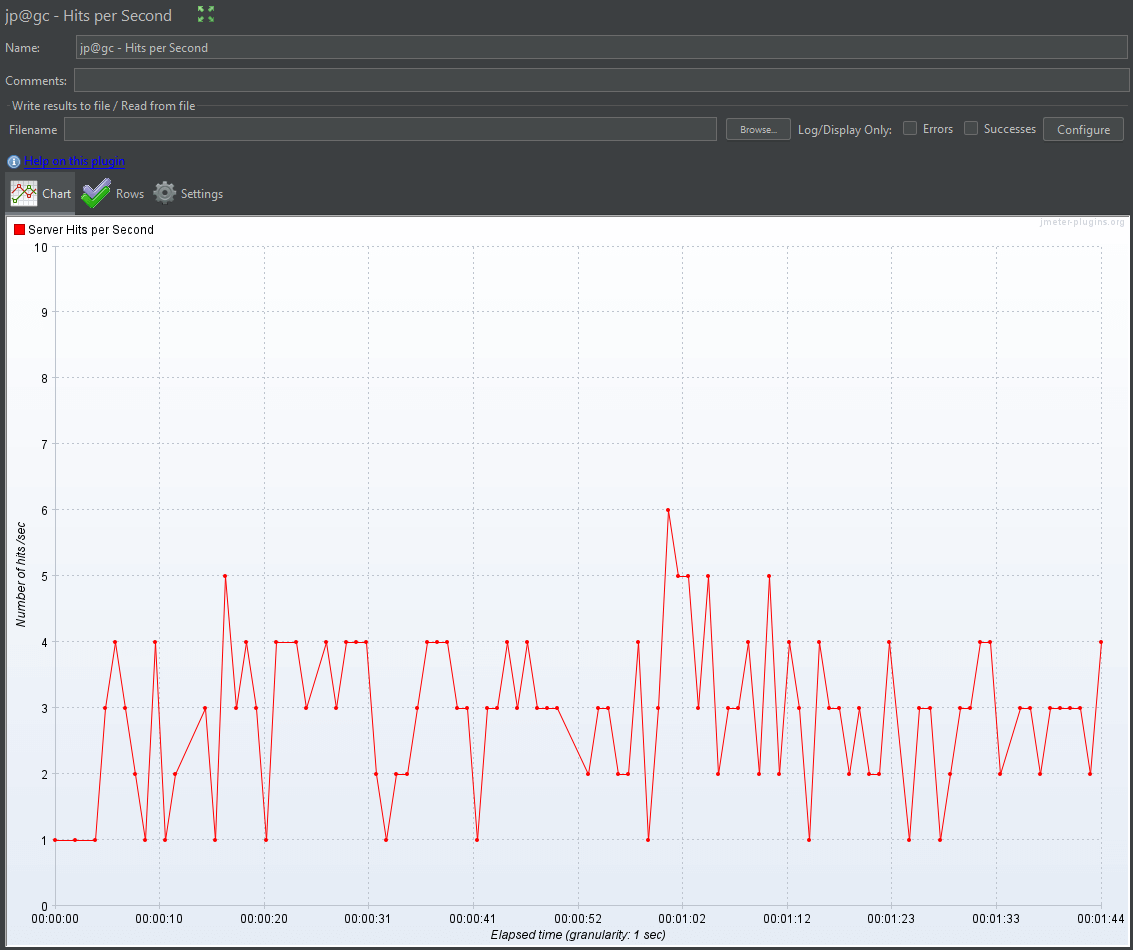
The Hits per Second listener provides a clear graphical representation of the number of hits received by the server every second. This helps in identifying patterns and any performance issues under different loads.
You can directly monitor and analyze the hits per second during your load tests by using the Hits per Second listener from the JMeter Plugins. This provides a precise measurement of your server's performance under different load conditions, helping you identify potential bottlenecks and optimize your application's performance.
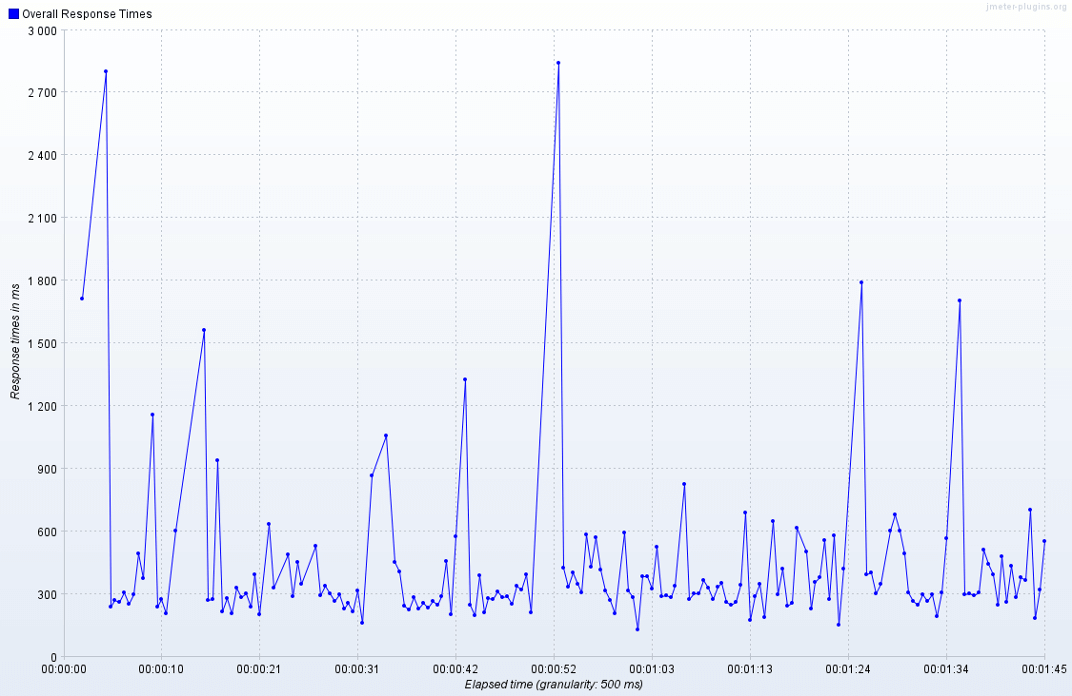
Response time
Download it here.
In Apache JMeter, listeners for response time are essential for monitoring and analyzing the time it takes for your server to respond to requests during a load test. This helps in identifying performance bottlenecks, and ensures that your application meets the desired performance criteria. Here are the key listeners you can use to monitor response times in JMeter:
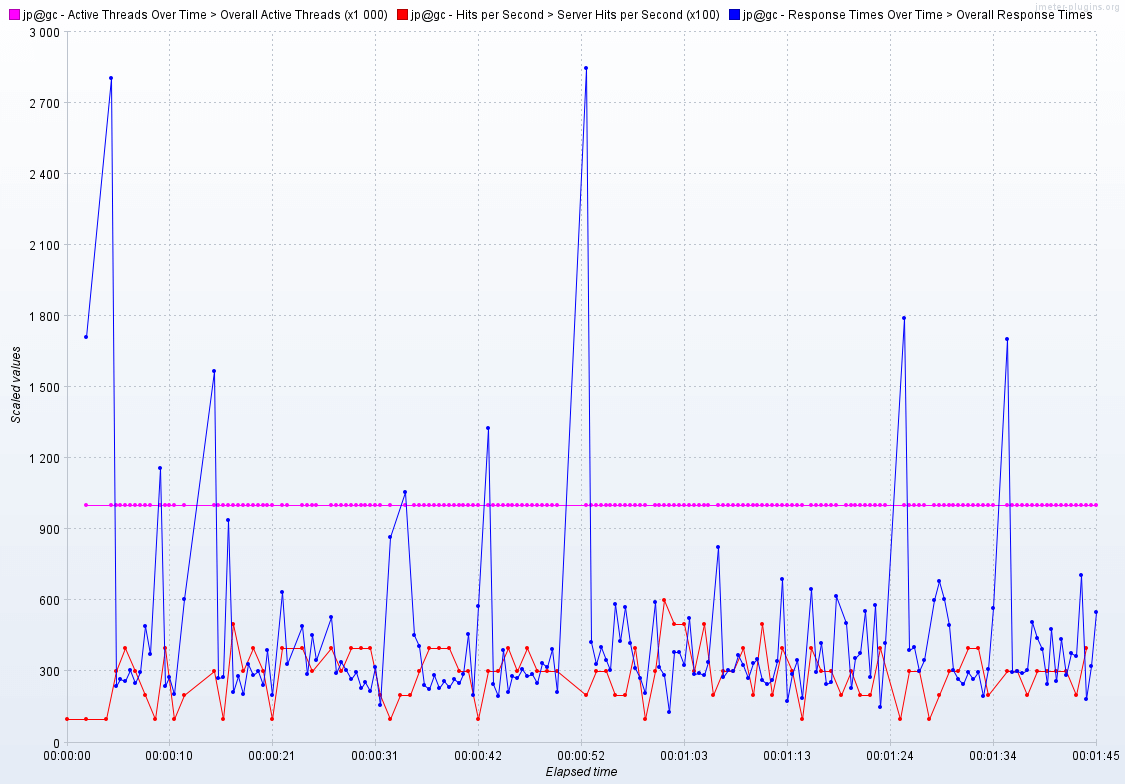
The Composite Timeline Graph
Download it here.
The Composite Timeline Graph is a useful JMeter plugin for comparing the results of different test runs on a single graph. This can be especially helpful when you want to analyze and visualize how changes in your test setup or application affect performance over time.
Conclusion
JMeter is a robust tool for performance testing, and its capabilities can be significantly enhanced with the right plugins. By integrating plugins like Step Thread Group, Ultimate Thread Group, HTTP/2 Plugin, and various listeners, you can tailor your tests to mimic real-world scenarios more effectively.